Author Archives: Faihaa Khan

Digital Gardens Update 4/28/22

In the final weeks before presenting my group and I had made several changes to our WordPress site. In order to match the scope of our new and improved project theme we decided, with the help of our Tableau guru Kelly Hammond to frame our work more like a story. If you look to our website we now have multiple tabs most of which are under the title of a question. Kelly gave us the great advice of setting our work up as an inquiry to entice the viewer to click and investigate. Because our project is now driven more towards those already involved in the garden sphere we narrowed down our visualizations to what could possibly of interest to them. At the time of writing this post we have about 3 1/2 visualizations already up. By the completion of this website we will have about 5 charts and maps. Here is a look of what we have so far: *Note some posts are still in a work in progress*

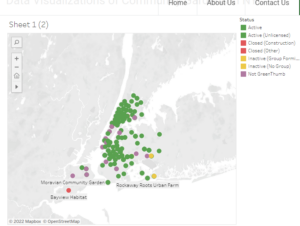
1.Where are NYC Community Gardens?- This interactive map showcases NYC’s “digitally listed” gardens via data found on Greenthumb and Open NYC. This map allows users to click through several categories coinciding with the status of the garden (active, closed, inactive etc.) We felt that this was important information to share as it gives a sort of one stop shop look at what gardens in NYC are open and operating and which are left stagnant. We imagine this data may be helpful to those who may wish to take over a space left abandoned or perhaps give an introspective look to an area in NYC that lack and are in need of green spaces.

2. What is the Area Income of Community Gardens?- Our second interactive map shows the general household income associated with number of gardens per zip code. Kelly gave us the idea of correlating number of gardens with the size of the circles. This gives a more clear indication of the density of gardens per area. By observation one can see that most gardens are situated in lower income areas. This may be linked to produce and a need for more resources and outdoor space. In order to see how community gardens improve the general space for living we will also have a map connecting air quality in neighborhoods brought on by the affect of the green spaces.

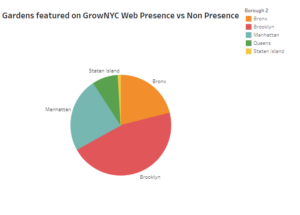
3. How Many Gardens can you find on the Web?- A interactive pie chart showcasing the number of gardens in each borough with a web presence. This vis is more of a forward suggestion to those involved or looking to start a CG.  Having a digital identity is almost crucial these days to be known in the world. As Digital Humanists coming in to this project we felt it was our due diligence to push this angle 🙂 (we also wanted to tie in our original idea)

4. What do NYC’s Community Gardens Produce?- This is a 2 part vis. The map portion that is already uploaded lists gardens featured on GrowNYC that are listed as having produce. The type of produce and neighborhood are shown as well as an indicator to show which gardens give away produce (Could go to residents, farmers and markets or all the above). This map was inspired by an interviewee who was interested in knowing what other gardens grew. We presume those involved in green spaces will also share a similar interest. Perhaps to gain insight or maybe even inspiration.

We still have a few more tabs on our webpage we need to fill with information but we hope to finish up our website by the projected date of 4/30/22. In other news I was able to attend the Tulip Festival at West Side Community Garden over Spring Break. While there I talked with the treasurer and volunteer who were very excited over the prospects of our project. I will upload the photos from my visit in our photo tab soon!


Digital Gardens Update 4/14/22

Based off of feedback from our classmates and Prof. Maney my team members and I decided to look over the details of our project again to ensure and really set in stone what the purpose of our project is and how we can go about improving it from here. With a brief overview of what we have accomplished as a team thus far we have found the intent of our project didn’t change but that we had added to it in a way we didn’t originally account for. From the start of of our journey we were positioned on the path of creating a digital repository of information on NYC green spaces to answer the question of “What is a Community Garden in the Digital Age?”  Our infographics would of provided a one all stop for those interested and already involved in the gardens. Although we still feel this is a solid proposal, we wanted to shift the scope of our project to better reflect the current direction of what we feel our website and findings are really trying to show. Below is our first draft revision of our new objective.

Community Gardens started with seed bombs and vacant lots, today there are more than 500 gardens spread out in NYC but what is a community garden? Our project uses methods of data visualization and ethnographic interviews to explore who, how and what is accessible within these green spaces and what the effects of these gardens mean for the community that surrounds them. Our audience centers mainly around those already involved as we are approaching what they are familiar with  from a research perspective. By bringing awareness to the effects of these gardens we hope to improve the current standing of them on both a local and state level.

Additional Advantage

Through our research and ethnographic work we found that Community Gardens are largely funded by the grants provided by the federal Housing and Urban development program and  then further financed by membership payments. We hope for our work to come in use when applying for these grants- we are attempting to create solid evidence of why city green spaces are vital for the community and the environment.

Milestones, Adjustments & Going Forward 

In order to meet our milestones and keep in schedule with our deadlines and revised scope of our project we have decided to condense our number of visualizations to 4.

  1. Map of Income Levels- Showcase demographic of people participating/Who it is important for?
  2. Pie Chart of Web Presence- How accessible are Community Gardens?
  3.  Produce- What neighborhoods provide/give back to the community
  4. Plant Life of Gardens (will try to connect to the air quality of boroughs/neighborhoods- we have available data on both)

This Saturday we will be meeting with Kelly Hammond, the lead developer for the Who Wins with Book Awards? project. Her Tableau expertise will help us improve and advance on our journey of visualizing our findings. Please look forward to our finished work 🙂

We have also taken down the notes and comments given to us during the mock presentation and will make the following improvements in the coming weeks: fix logo to account for individuals who are visually impaired, change tone and opacity of colored points on map, change up text and image formatting for pull quotes, shorten text for final PowerPoint presentation. Lastly everyone seemed to really appreciate our use of images so we will definitely be creating a photo tab for our website (we have a lot of great pictures!)

For now enjoy these pictures Benjamin has taken when doing another interview.


*Please refer to last post for Spring break details, I meant it to put it in this post.

Digital Gardens Project Update 4/7/22

As we’re inching closer to the end of the semester my team and I have been steadily working on visualizing all the data that has been collected the first few months of our project development. As we’re producing these infographics we will also be uploading them on to our CUNY Commons website.  If you look to our site now you will see a tab labeled under Data Visualizations of Community Gardens in NYC. This tab is still a work in progress as we’re still figuring out the the functions of a page on a commons site. Every time we try to put a separate posting on our tab the vis ends up on the homepage instead of the designated tab. For now we’re putting our finished charts and maps on to one page but we will figure out how to make this more organized. Below are still images of what we have so far. (Make sure to go to our website to use the interactive features.)


The interactive map showcases community gardens in NYC and their current status. To make the points on the map clearer the viewer can click on the different colored squares on our key and highlight the specific points they want to observe. We felt the present day standing of the gardens was pertinent information to show for a number of reasons. For one it makes it easier for the average user to see what green spaces are active and available for use in their area. Please stay tuned for our critiques and explanations on this map when we provide an accompanied written section on our website.

For our pie chart we did a web scrape of the gardens featured in GrowNYC.com and investigated which gardens had an info page on their respective gardens and which didn’t. From there we compiled a list on the ones that did not and proceeded to do a deep dive exploration if these gardens had any web presence at all! With the help of a hover over feature the viewer can see how many gardens in each borough are web anonymous- a rare characteristic in this current day and age.

Milestones

According to our workplan we are pretty much on track for what we wished to accomplish by this timeframe. The data collection portion of our project has been completed so now we’re are focusing on what we have and how to present it, something we wished to do by this time! However with that being said looking towards the future and the allotted time left my team members and I have discussed the possibility of cutting down the scope of our visualizations. Originally we planned on displaying a total of 6 forms of data: Active vs Non Active, Income levels by area, gardens that supply produce, gardens supported by Obesity Task Force, plant life of gardens & Digital web presence. Although we would ideally like to have a chart or map for all of these we figured we may have to disregard 1 or 2 to stay on schedule. I also think it’s important to mention that all of us are beginners at Tableau and are learning as we go along. This means making a vis requires quite a bit of time on our part. Our team member Nelson who is the main member in charge of the vis’ has even reached out to a GC Digital Fellow for assistance. Unfortunately the fellow did not have much knowledge in the software program but did give pointers on how to organize our data sheets to make it easier to import and use, this was definitely a big help to us.

On the other side of our project, our ethnographic research has been progressing. As we had mentioned previously we have an interview with the oldest community garden member done by Benjamin, coming soon to our website. Before uploading we have condensed the audio file to an Mp3, constructed a transcript and pulled notable quotes we felt were compelling. These quotes will be sent to the interviewee who will give us the go ahead to upload. Benjamin will be visiting Quincy Community Garden on Saturday to do an observational study. By the end of this project we hope to have 3 interviews up.

Spring Break & Going Forward 

During Spring break all team members will be working independently. At this point we are all working on different aspects of the project simultaneously so our weekly meetings may take a pause to allow for more work time. With that being said we are always keeping in touch via our WhatsApp group chat to fill each other in on work that has been completed or in progress.


Digital Gardens Update: Website and More!

Over the past few days my team and I have focused our efforts towards our outreach plan. Because our project is based upon being informative and providing new data on community gardens we have labeled our work as being a form of awareness as well. In order to get the word out there about our research and data we knew providing  platforms of outreach was integral. Our hope for this project has always been to help the niche audience we are trying to target, so in order to do so we have already set up a digital footprint for ourselves to present our information.

The first web item we have established is a twitter page(https://twitter.com/gardens_dh). As stated before on our social media/outreach plan we decided to go with the networking service for a number of reasons. First being the fact that we wanted our presence to be known on a site that is known to host professional and educational accounts and organizations. Our tone for our project is meant to be informative and educational so we felt twitter was a better option in comparison to instagram and tik tok. Furthermore we wanted a place where we could share findings (online and our own) and connect with others that are involved with green spaces in NYC. We are still in the beginning stages of our twitter since we are still developing our visualizations and logo. For now we left a tweet telling potential followers/viewers that we will have a website up soon..Each week the twitter will be updated by a member of the group. Once we have the bulk of our website finished we will share the link on our page and have a proper header and icon image

Our website in question is a site hosted on the CUNY Academic Commons (https://digitalgarden.commons.gc.cuny.edu/). This web page will display our data visualizations and findings and will also feature a tab that will include audio files taken from interviews in accordance to our ethnographic research. Due to the fact that we are still in the workshopping phase of our website, we don’t know yet how many tabs we will have featured on our page. Perhaps we will create one for various photos we have taken at the gardens as well, since some of us were able to individually visit some during spats of pleasant weather. 2 of our photos have already been used when designing the appearance of our site. The background image was taken at Clinton Community Garden while the header image is from Liz Christy Garden (these images may be subject to change in the event we find something else more suitable). Our font and highlight color are a dark green to keep in theme with the nature aspect of our project. We made the conscious decision to make the shade of green darker than our counterparts Greenthumb and NYCGovParks who opted for a lighter shade of green. This was kind of our subtle way to show that we were a different kind of community garden site, not one that the public has seen before. Aside from our customizations our site for now has an home page describing our project and an about us section that features our personal bios. Additionally our page is public so that those who visit our twitter can click on a link to our site. We are also planning on sending out the url to community garden leaders and those who we wish to interview. Please feel free to visit our site once we have more information up. 

Aside from Twitter and our Cuny commons site we have also decided to start a Facebook page (NYC Community Gardens – Home | Facebook). Our page thus far has some photos taken at community gardens we visited. Once we start visualizing our findings we will try to incorporate that as well. As we mentioned before, community garden Facebook pages are quite inactive but as a way to connect with gardens and message them directly we will keep our Facebook page up. This will also be used as another account to promote our website.  

Lastly, our team member Benjamin has already made progress in the interview section of our project. We managed to get an interview from the oldest community garden member (from 1972)  from the oldest community garden in NYC. The interview audio will be on our website soon. Be sure to check it out once it’s uploaded! Without giving too much away of what he said, we will say that he did mention that he is interested in the specific produce gardens have. This will be something I’ll be looking into soon. Next week Benjamin will be going to East Village for another interview!

Going Forward 

Heading into next week we will continue on our path to visualizing and playing around with the features on Tableau. Since we want to make connections with our data to convey information and stories that have not have had coverage yet, we are utilizing the layering technique for our Tableau maps. Using this will allow us to show 2 forms of data at once which will in turn give the audience a sense of correlation when viewing the infographic. We have already reached out to a Digital Fellow for further assistance on this task and they will hopefully be getting back to us soon. Additionally with some advice taken from Professor. Maney we will also be cleaning up some features on our social media and website. The inclusion of a contact tab and logo image will be up by the end of the week (hopefully). Throughout the rest of the week and the next our work will be more conducive to website building as this will be the main product of our final project.

What is a Community Garden in the Digital Age?- WORK PLAN

Week 4 

Work task:

What is a Community Garden in the Digital Age? Finalized

Deadlines: Upload new and revised Project Proposal to Course Website (Faihaa)

Week 5 (March 2)

Work task:

Data Collection Breakdown (Faihaa/Nelson)

Brainstorm questions and explore data available online. Spend 2-3 hours (Faihaa/Nelson/Benjamin)

Check to see if each borough has 311 open data

Deadlines: 

– Discuss and brainstorm specific data our project will account for

– Analyze data information already available

Week 6 (March 09)

Work task:

Finalize specific data we wish to use

Organize data into separate spreadsheets (Faihaa)

Design ethnographic research and reach out to community gardens (Benjamin) 

Deadlines:

– Workplan

– Data Management Plan (Nelson)

-Personal Journal Entries (3/8/22)

-Group Outreach/Social Media Plan Group Project Update (3/10/22) (TBD)

Meetings:

Tuesday 9 of March 12.00: Group meeting

Friday 12 of March 11.00: Group meeting

Week 7  (March 16)

Work task:

Start to upload info on to Tableau (Nelson)

Use visualization and spreadsheets to find connections and discrepancies (Faihaa, Nelson, Benjamin)

Start looking into Website options to display visualizations

Do interviews and participations for ethnographic research

Deadlines: 

– Tableau Map

-Personal Journal Entries (3/15/22)

Meetings:

Tuesday 16 of March 12.00: Group meeting

Week 8 (March 23)

Work Task: 

– Create a draft on what website can potentially look like and start building the website

– Discuss what we wish to include on landing page, tabs etc

– Do interviews and participations for ethnographic research

– Start transcribing ethnographic interviews

Deadlines: 

Personal Journal Entries (3/22/22)

Group Project Updates (3/24/22)

Meetings:

Friday 26 of March 11.00: Group meeting

Week 9- Week 11 (March 30-April13)

Work Task: 

Work on website 

Highlight new data found

Create powerpoint presentation on project

Continue doing interviews and analyze ethnographic data

Deadlines: 

Personal Journal Entries (3/29/22 4/5/22 4/12/22)

Group Project Updates (3/31/22 4/7/22 4/14/22)

Week 12  

SPRING BREAK 

Work Task:

Independent Work on Project permitting time 

Week 13- Week 14 (April 27-May 11)

Work Task: 

Final adjustments to data visualizations and website.

Audio from interviews uploaded.

Work on Written portion of project

End of week 14 have a website/platform ready for feedback and review

Deadlines: Personal Journal Entries (4/26/22 5/3/22)

Group Project Update (4/28/22)

Week 15 

Work Task: 

Smaller adjustments to website/platform from feedback session

Prepare for project launch

Finalize website

Deadlines: 

Finish final website

Week 16 (May 18)

Work Task: 

All work should be completed!

Deadlines: Post Final Group Project to Commons

Email individual reflections to Prof. Maney


Faihaa Khan Personal Bio/Contribution Statement

Faihaa Khan graduated from St. John’s University with a B.A in English in 2017. Her bachelor’s education focused on literary studies and journalism. Skills attained in those fields has led her to various job opportunities. In 2015 she worked as a lifestyle blogger and fashion intern at World Bride Magazine and in 2016 she worked as a Corps Member at Jumpstart; an early education program designed to help preschoolers from under resourced communities improve language and literacy skills. Present-day she is working as a typist/desk supervisor at a New York newspaper alongside editors, reporters and writers.

Faihaa is also currently a second year M.A. student in Digital Humanities at the CUNY Graduate Center. Throughout her studies she is eager to learn about tech programs and data visualization methods that will expand her arsenal of skills. Aforementioned skills attained will help her find career opportunities in media research-her current dream profession.

Furthermore she is also serving as Project Manager/Documenter on the digital project known as “What is a Community Garden in the Digital Age”. Her contributions to the project will include being the general overseer of the group, keeping track of Google spreadsheets, listing data that has been found thus far, keeping track of all contact info and assisting with collecting, organizing and analyzing data.


Revised What is a Community Garden in the Digital Age?

Brief overview of project

New York City is often known as a “concrete jungle.” While we envision a gray and black landscape, not many pay attention to the actual green foliage that quietly engulfs the city. During the Covid-19 pandemic the interest in green spaces heightened and highlighted the necessity of green areas for people living in New York in order to ensure their well being. One way to encounter and interact with green spaces are the many different community gardens spread all over NYC which have a long history dating back to the 1970s. But as the world progresses deeper and deeper into a tech driven society, humanity must do their due diligence in keeping up. This seems to be a contradiction given the wholly untechnical nature (pun intended) the point of these gardens hold. But how can we come to understand community gardens by exploring their digital presence? and what does this mean to the garden’s work? Those are the questions we hope to answer in our project. To complete this task we will look into data sets and information taken from already established websites such as GrowNYC and Greenthumb as well as data census’ on community gardens. Once we compile as much information as we can, we will visualize them through Tableau and upload our data vis models onto an interactive website. Our goal for this project is to not only make this curated data more readily available, but to also highlight trends and oddities that have gone unnoticed from previous data collection. Additionally, to create a project that also reflects the people of these gardens, we will also try to conduct a smaller ethnographic research study to better get an understanding of the importance of these gardens’ digital presence. Moreover, with the myriad of gardens available in NYC we anticipate the possibility of some not having info available on the web. Our project will also likely be an outlet for these “web anonymous gardens” to have a digital footprint. In all we consider our work to be data collection as well as an awareness project. Our end goal is to help both the gardens and those interested in learning or helping these gardens. 

The question/problem it helps answer:

In essence, we are aware there is already a  plethora of digital information on community gardens available. Our objective is focused on helping these gardens become even more digitally accessible in a way that is more engaging. The graphic representation we will provide will be an effective and easier way to communicate the vast data already collected. As mentioned above we will complete this task by looking into data sets and information taken from already established websites as well as a public data census’. Then we will scan the digital presence of each and every community garden in New York CIty and create a visual map of gardens that have a presence and those that do not. This map will have different components that will aggregate the data found in our research. We will also do a deep dive that showcases the different types of community gardens and how they label themselves. We believe that this can be beneficial to local residents who would like to know what the gardens around them have to offer as well as an indicator to divulge if individual info is available on a website/social media account. The omission of a web presence can bring awareness to the community and possibly provide an incentive for those involved to create one for their garden. This can in turn highlight potential new ways of engaging volunteers.   

Project audience

This project will be for those interested in getting a better understanding of what a Community Garden is, but we will mostly focus on people interested in joining a community garden. Our work will also be beneficial to future data researchers/digital humanists who wish to expand on the digital work centered around these gardens. 

Contribution to DH & potential impact:

We do not wish to recreate digital portals like GrowNYC and Greenthumb. Instead we hope to explore what is a Community Garden as digital humanists by looking at data available online. Our project will create a digital interactive map of NYC showing information about the different types of gardens, sizes, accessibility etc. It will be for anyone to explore what these gardens’ digital presence can tell us about what it means to be a community garden in New York City. This blueprint web resource can hopefully be a hub for those interested in learning or interacting with these spaces, and help create awareness for the community gardens. In addition we will re-engage dead or outdated websites and have their digital presence reignited. Our ethnographic research will attempt to find out the reason why some of these gardens do not have a digital presence established, among other unforeseen questions. Perhaps their answers will lead to the discovery of discrepancies within the community. As mentioned above this will also be beneficial for other digital humanists working with community gardens.

Feasibility assessment:

The data needed to create a proof of concept model for this digital project can be collected in the duration of a college semester. We are aware that our small ethnographic research might only be possible later, since many gardens are closed at the moment due to the winter weather and non public entry. 

What digital tools/methods/team member skill sets will be needed to realize the project?  Project Manager/Documentation: Faihaa

Will be the general overseer of the group and plan for steps to move along progress, will keep track of Google spreadsheets listing data that has been found thus far, Will keep track of all contact info, will be involved with collecting, organizing and analyzing data.

Developer/Designer/ethnographic research: Benjamin

Will design and conduct small ethnographic research with the targeting group, build a website (or other digital representation) and assist on researching

Documentation/Research– Nelson 

Will be able to collect data. Able to travel and communicate with community garden leaders. Able to research historical information regarding community gardens in NYC. Eager to learn digital tools in order to present data visually, either by graphs or maps. 

All team members will be involved with Outreach. Our project also counts as Outreach!

TOOLS

We are interested in using Tableau Online and creating a WordPress interactive website

Legal or technical barriers

  1. Communicating with community leaders at the garden. Possibility that they won’t respond or want to divulge information that can be made public. 
  2. The data we collect might not be sufficient enough to create a meaningful project.
  3. Time constraints might be too much .
  4. Unforeseen events: Weather, Covid restrictions, online tools become unavailable?

How will you tackle those potential pitfalls if your project is selected?:

  1. The team would have to find creative ways to collect data overwise, via already established information on the web or contacting people who do similar projects. 

2.Reduce and shift the amount of gardens that are being contacted. Possibly restrict the type of data that is being collected. 

3.The team would need to have the foresight and have conversations among themselves on how to lead this project in the most ethical way possible. 

 4.The team would need to react accordingly and be quick thinkers.

Final product (even if tentative):

It is our intention to build an interactive website/tableau/map to present the collected data that we hope gives a better understanding of the digital presence of community gardens and their accessibility.

Python: A Gentle Introduction Workshop Reflection


Python Programming Language | Learn Python With Examples | Edureka


When I first entered the Digital Humanities field I knew I wanted to gain more knowledge and experience within the realm of programming and coding. Skills attained in this discipline will not only help me with future projects but will also open the door for more opportunities in tech.

However with no prior experience in the mechanics of computing I knew early on this would be quite the arduous task for me to take on. I mean lets face it, data programming is not something you can learn overnight with a few YouTube tutorials and google searches. I do wish that were the case but seeing as though it’s not it was obvious to me early on that I had to take things slow to really ease myself into this meticulous field.

This is where Python: A Gentle Introduction comes to play. Hosted by Fordham University Science and Technology librarian, Katie Wolf, this workshop walked students through the general use programming language known as Python. Wolf began the workshop by giving us a basic run through of the general functions and usability of the app. Below I have listed a few in case anyone is curious and/or interested in using it.

-Interpreted language (Does what user tells it to do)

-“Object oriented”- Almost anything put into Python is considered an object

-Can visualize data

-Can be used to edit and create files

-Can interact with web (scrape website, parse html etc.)

Afterwards she brought up her version of Python as well as a text editor to give us live demonstrations of different ways a user can code on the app. Prior to the workshop we were all told to download Python on to our computers/laptops so that we may follow along using her examples. The version I installed was 3.10.02 (64 bit) for Windows (different version for Mac OS users).  As far as my text editor is concerned I did not have any of the ones Katie recommended on hand but she reassured me that was fine as long as I had a program I could write on. I ended up just using my notepad app.

Text editor Recommendations– SublimeText (TE), Atom (TE) or Atom-IDE (IDE), IDLE (IDE) for Windows, Visual Studio Code (IDE)

Once we had both open we opened up a command line interface where we were able to run our python scripts. In my case I had to use Powershell which was already available to me as a Windows user (Mac OS users use Terminal). Now that we had all the appropriate applications opened Katie was able to walk us through a variety of basic operations we can perform using Python. We started off first with variables. Variables can store information and be assigned any data type, however the user has to input the variable correctly in order for Python to understand. The variable must start with a letter or underscore (NO NUMBERS) and can’t contain any special characters or spaces. For example if a user wanted to type in the word “hello” it would have to be typed in as A= “Hello” or A_variable= “Hello”.

Once we finished with variables we moved on to basic data types such as strings, integers, floats, operators, lists and dictionaries. At this point the workshop turned more into a viewing than a follow along for me as Katie had premade strings made from previous coding attempts. I made the decision to watch rather than perform because my first attempt at coding while listening turned out to be a fail (I kept missing information and got hit with multiple unknown and syntax errors).  Here are some notes I took during the demonstration if anyone is interested:

Strings are always surrounded by quotes, loop able and countable, ex – a=”hello, world!” print (a.split (“,”)) – > [“hello”, “world”]  integers are whole numbers both positive and negative, floats are positive or negative numbers with decimals

Operators are used to perform operations on variables or values Arithmetic ex (+,-,=,*, /,%, etc.) Assignments ex (=, += ,-=, *=, /=, %=, etc.) Comparisons ex (==, !=, >, <, >+, <=) Logical, Identity and Membership (and, or, not, is, is not, in, not in)

Lists can store multiple items in a single variable with the use of square brackets [ ] and are indexed at zero. You can use method append () to add things to a list remove() to remove things from a list clear () to empty list completely, sort () to organize a list alphabetically and numerically etc.  Tuples have the same function but use round brackets/parenthesis ( ) Example:

Dictionaries are able to store multiple items in key: value pairs and use curly brackets { }. They can be ordered and changeable but don’t allow duplicates. Dictionaries can only be ordered in Python 3.7 and newer versions. Use keys() to see all keys, values() to see all values items () to get all key: value pairs and update() to change the value of the key: value pair. Example:

These are only a few of the items you can perform on Python. Hopefully my notes are clear but I can understand if this may look foreign to someone who has never coded before. That was certainly my reaction over the course of the workshop. There were several moments throughout the session where I found myself getting lost and falling behind. But that’s ok! Like I said coding is not something you learn overnight, it’s a skill you keep working on until you get comfortable-something even Katie made sure to mention during the demonstration.

With that being said my first baby step into programming has definitely been an impactful one.  Overall this workshop was highly informative and helpful. I left having a basic understanding of what Python is able to do and how I’m able to make it perform as a Windows user! I want to also give major props to Katie who not only answered questions along the way but also took the time out to stay behind on the zoom call in case anyone needed further assistance or explanation.

Here’s the simple code I created with Katie’s help:          

Faihaa’s Skillset

Hey guys! My name is Faihaa (pronounced Fai as in Hi and then ha). I have a bachelors of arts in English and I am currently working part time at a news company where my duties include desk supervision, customer service and typist work! When I’m not part time at my job I’m here at the GC being a part time student. As a second year in the DH program I’ve had my fair share of time spent working in certain computer programs but I still have so much to learn. With every class taken I hope to broaden my skill set in the world of data and tech.

Project Management– I have had experience in managerial duties at work. I’m good at organizing tasks and keeping up communication with those that I’m working with. With that being said I’m not particularly comfortable taking on a leader role for a project I did not create, however if no one else in the group wants to take this role on I would be happy to accept.

Design/UX–  I don’t have much technical expertise in this field yet (currently learning) but I am definitely a person who highly believes that the visuals aesthetics of the data presented is just as important as the data itself. I can offer ideas on how to present findings and look into art work to help accompany the project.

Documentation- Depending on the scope of the project this may be a rather large role to take on, but I am willing to do it. Because I can’t offer much on data programming and designing, I will be more than happy to keep track of notes, findings, pictures, locations, names etc. I can create and maintain excel spreadsheets and google docs if need be.

Outreach/Social Media- As someone who is right on the cusp between millennial and gen Z… let’s just say I’m no stranger to social media. I am comfortable with taking on this role if no one else wants to do it.

Developer- Unfortunately this is not my field of expertise.

Research– I’m able to look up information to help find valuable resources but I tend to heavily rely on the internet as my main source. .