Based off of feedback from our classmates and Prof. Maney my team members and I decided to look over the details of our project again to ensure and really set in stone what the purpose of our project is and how we can go about improving it from here. With a brief overview of what we have accomplished as a team thus far we have found the intent of our project didn’t change but that we had added to it in a way we didn’t originally account for. From the start of of our journey we were positioned on the path of creating a digital repository of information on NYC green spaces to answer the question of “What is a Community Garden in the Digital Age?” Our infographics would of provided a one all stop for those interested and already involved in the gardens. Although we still feel this is a solid proposal, we wanted to shift the scope of our project to better reflect the current direction of what we feel our website and findings are really trying to show. Below is our first draft revision of our new objective.
Community Gardens started with seed bombs and vacant lots, today there are more than 500 gardens spread out in NYC but what is a community garden? Our project uses methods of data visualization and ethnographic interviews to explore who, how and what is accessible within these green spaces and what the effects of these gardens mean for the community that surrounds them. Our audience centers mainly around those already involved as we are approaching what they are familiar with from a research perspective. By bringing awareness to the effects of these gardens we hope to improve the current standing of them on both a local and state level.
Additional Advantage
Through our research and ethnographic work we found that Community Gardens are largely funded by the grants provided by the federal Housing and Urban development program and then further financed by membership payments. We hope for our work to come in use when applying for these grants- we are attempting to create solid evidence of why city green spaces are vital for the community and the environment.
Milestones, Adjustments & Going Forward
In order to meet our milestones and keep in schedule with our deadlines and revised scope of our project we have decided to condense our number of visualizations to 4.
- Map of Income Levels- Showcase demographic of people participating/Who it is important for?
- Pie Chart of Web Presence- How accessible are Community Gardens?
- Produce- What neighborhoods provide/give back to the community
- Plant Life of Gardens (will try to connect to the air quality of boroughs/neighborhoods- we have available data on both)
This Saturday we will be meeting with Kelly Hammond, the lead developer for the Who Wins with Book Awards? project. Her Tableau expertise will help us improve and advance on our journey of visualizing our findings. Please look forward to our finished work 🙂
We have also taken down the notes and comments given to us during the mock presentation and will make the following improvements in the coming weeks: fix logo to account for individuals who are visually impaired, change tone and opacity of colored points on map, change up text and image formatting for pull quotes, shorten text for final PowerPoint presentation. Lastly everyone seemed to really appreciate our use of images so we will definitely be creating a photo tab for our website (we have a lot of great pictures!)
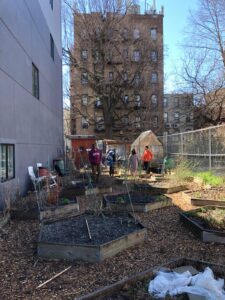
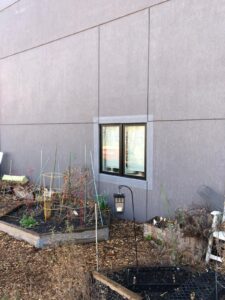
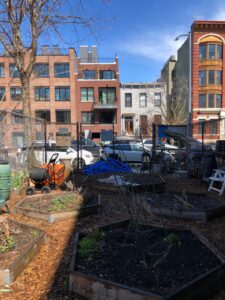
For now enjoy these pictures Benjamin has taken when doing another interview.


*Please refer to last post for Spring break details, I meant it to put it in this post.


