
As we’re inching closer to the end of the semester my team and I have been steadily working on visualizing all the data that has been collected the first few months of our project development. As we’re producing these infographics we will also be uploading them on to our CUNY Commons website. If you look to our site now you will see a tab labeled under Data Visualizations of Community Gardens in NYC. This tab is still a work in progress as we’re still figuring out the the functions of a page on a commons site. Every time we try to put a separate posting on our tab the vis ends up on the homepage instead of the designated tab. For now we’re putting our finished charts and maps on to one page but we will figure out how to make this more organized. Below are still images of what we have so far. (Make sure to go to our website to use the interactive features.)
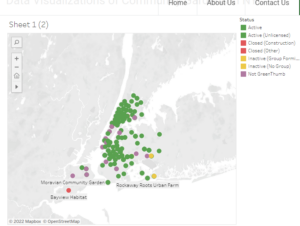
The interactive map showcases community gardens in NYC and their current status. To make the points on the map clearer the viewer can click on the different colored squares on our key and highlight the specific points they want to observe. We felt the present day standing of the gardens was pertinent information to show for a number of reasons. For one it makes it easier for the average user to see what green spaces are active and available for use in their area. Please stay tuned for our critiques and explanations on this map when we provide an accompanied written section on our website.
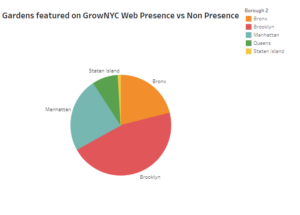
For our pie chart we did a web scrape of the gardens featured in GrowNYC.com and investigated which gardens had an info page on their respective gardens and which didn’t. From there we compiled a list on the ones that did not and proceeded to do a deep dive exploration if these gardens had any web presence at all! With the help of a hover over feature the viewer can see how many gardens in each borough are web anonymous- a rare characteristic in this current day and age.
Milestones
According to our workplan we are pretty much on track for what we wished to accomplish by this timeframe. The data collection portion of our project has been completed so now we’re are focusing on what we have and how to present it, something we wished to do by this time! However with that being said looking towards the future and the allotted time left my team members and I have discussed the possibility of cutting down the scope of our visualizations. Originally we planned on displaying a total of 6 forms of data: Active vs Non Active, Income levels by area, gardens that supply produce, gardens supported by Obesity Task Force, plant life of gardens & Digital web presence. Although we would ideally like to have a chart or map for all of these we figured we may have to disregard 1 or 2 to stay on schedule. I also think it’s important to mention that all of us are beginners at Tableau and are learning as we go along. This means making a vis requires quite a bit of time on our part. Our team member Nelson who is the main member in charge of the vis’ has even reached out to a GC Digital Fellow for assistance. Unfortunately the fellow did not have much knowledge in the software program but did give pointers on how to organize our data sheets to make it easier to import and use, this was definitely a big help to us.
On the other side of our project, our ethnographic research has been progressing. As we had mentioned previously we have an interview with the oldest community garden member done by Benjamin, coming soon to our website. Before uploading we have condensed the audio file to an Mp3, constructed a transcript and pulled notable quotes we felt were compelling. These quotes will be sent to the interviewee who will give us the go ahead to upload. Benjamin will be visiting Quincy Community Garden on Saturday to do an observational study. By the end of this project we hope to have 3 interviews up.
Spring Break & Going Forward
During Spring break all team members will be working independently. At this point we are all working on different aspects of the project simultaneously so our weekly meetings may take a pause to allow for more work time. With that being said we are always keeping in touch via our WhatsApp group chat to fill each other in on work that has been completed or in progress.