
I attended the “Pandas: The Bare Basics” class on Friday February 11. Lead by Patrick Smyth, a PhD graduate of CUNY GC, and founder of Iota School, the workshop’s goal was to introduce students without programming experience to the pandas library for data analysis.

Data analysis in action
Before the workshop started, Patrick emailed attendees instructions to prepare a Jupyter notebook environment, offering two methods. For participants with a Google account looking for the least hassle, Google’s Collaboratory allows you to start up a Jupyter Notebook with all the libraries necessary installed automatically saved on your Google Drive. For Google skeptics, he also offered installing Anaconda and running a Jupyter notebook from that platform. Having some Python experience, I chose another method entirely. My previous experience with pandas is very limited to formatting JSON retrieved from an API into data frames or csvs, so i was interested in learning more about the data analysis applications for this library.
We began our journey by learning how to import pandas into our notebook, and work with the basic data structures in pandas: Series and DataFrame. Series represent one dimensional data; in Python an example would a list, which is a collection of discrete elements in an ordered manner, such that you can reference them by index. Note that in most programming, the first element is in the 0 index position. See the figure below
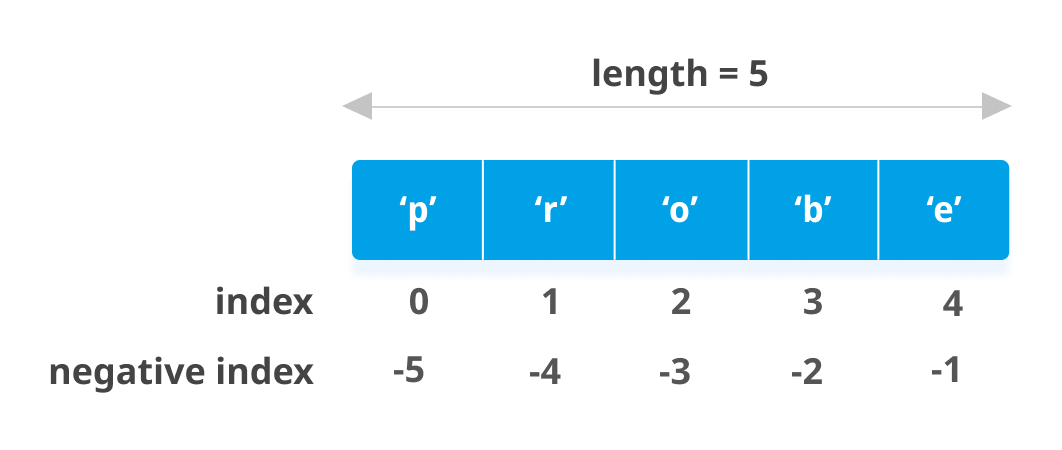
In a list, in this case [‘p’, ‘r’, ‘o’, ‘b’. ‘e’], you reference elements based on the index of the element. Example: getting the last element in a list without knowing how long it is, you’d request the -1 index (‘e’); getting the first element would use the index 0.

Rows are indexed by default as 0-n, columns have names identifying the attribute
The first hour of the workshop has us creating simple Python lists and dictionaries to run aggregate calculations like means, minimum and maximum values on pandas Series and DataFrames, and learning how to isolate one column in a 2 dimensional data set for analysis either by the column name or index.
The second half of the workshop was devoted towards performing exploratory data analysis (EDA) on a real dataset available online. We read in a CSV from Airbnb data, including data on rentals in the five borough of New York City. Because there was a strong contingent of Bronx and Queens participants in this workshop, we focused on comparing the average prices in various neighborhoods from those boroughs to the average in NYC overall. We also plucked out listings that might skew our averages.
What stuck with me the most from this workshop was the instructors comment that, while data analysis like this isn’t solely constitutive of a digital humanities project, having data analysis a one supporting pillar of an argument you want to make can be surprisingly effective. He spoke about using analysis with pandas/matplotlib in the context of boosting the efficacy of a particular program in an academic administrative presentation he gave last year.
I dropped the Jupyter Notebooks we worked on together in the workshop in a repo on Github for curious classmates.