PROJECT NARRATIVE
New York City is often known as a “concrete jungle.” While we envision a gray and black landscape, not many pay attention to the actual green foliage that quietly engulfs the city. Some greenspaces are only known as private gardens or residential parks. But between the tall buildings, often on vacant lots, you will find community gardens open to the public. When Covid hit New York City, there was a sudden mandate that required people to stay at home and isolate themselves. The need for interacting with outdoor surroundings became more crucial. The interest in green spaces heightened and highlighted the necessity of green areas for people living in New York in order to ensure their well being. One way to encounter and interact with green spaces are the many different community gardens spread all over NYC. It was GreenThumb, a division of NYC Dept. of Parks & Recreation, working with the support of over 500 community gardens in New York, that New Yorkers experienced an increased interest in becoming involved in Community Gardens under Covid.
The history of community gardens in NYC dates back to the 1970’s and involves a long past of resistance, engagement and active citizens who wished for more greenspaces in their communities. It was a time where New York City was hit by a fiscal crisis and many buildings were abandoned and torn down. This in turn created many vacant lots which lead to a movement of gardening activists using seed bombs to “grow” the spots together through planting window boxes and tree pits (Loggins, D. 2007). One of the gardens we visited; Liz Christy’s Community Garden, is by many considered the first of NYC. The garden was created by the namesake, Liz Christy and a group of young gardening activists known as the “Green Guerillas”. The green space, to this day, has a strong tie to its history. This is evident by our interview with the oldest known member of the garden. He was noted as saying just how proud he was of the garden being able to survive for 50 years without being built on or torn down. Instead, the garden has been developed and has thrived over the years with the help of many different volunteers over time. Today the garden still stands as a greenspace for those interested in gardening or wanting to enjoy a break from the busy city life.
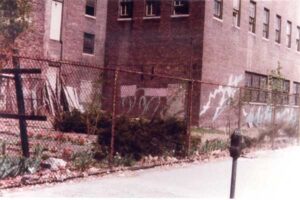
(date unknown – vacant lot where Liz Christy Community garden is today. Source: http://www.lizchristygarden.us)
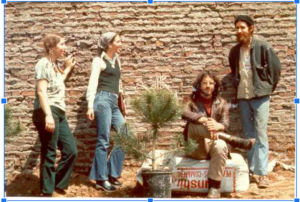
(date unknown – Photo from Liz Christy Community garden. Source: http://www.lizchristygarden.us)
But how can we define what a community garden is today? The American Community Garden Association defines a community garden as “any piece of land gardened by a group of people.” (Gittleman, M. Librizzi, L. Stone, E. 2010 p.9) and by that definition there exists many different kinds. Some are private, others are part of the Trust for Public Land but most in NYC are a part of the Dept. of Parks & Recreation, which also means they are associated with GreenThumb or GrowNYC. This, therefore, became our starting point when we decided to explore the topic further. With our project we did not desire to answer the broader question but to rather explore who, how and what is accessible within these green spaces and what the effects of these gardens mean for the community that surrounds them. The gardens exist as spatial places that are materialized and can be visited, but also exist digitally as websites, datasets, social media accounts etc. With this project we wished to answer our questions by engaging in both areas. Coming from a DH perspective, the digital portion was most imperative to us. As argued by Digital humanist, Brian Greenspan: “In today’s academy, we are all already digital” (Greenspan, Brain 2019). He further explains that as scholars, today we need to use digital resources and tools to conduct research. Therefore we decided to look into the present standing of community gardens by digital means and were fortunate to find different relevant and already collected datasets. To further add to the depth of our project, we also reached out to different community gardens to meet and speak with them in order to experience their spaces in a more embodied way.
Digital humanists have been using digital methods to both analyze and communicate academic findings, and with this project we wished to contribute to the field by exhibiting how using digital humanistic methods can show new perspectives on community gardens. As we stated before, our project uses methods of data visualization and ethnographic interviews to explore the who, how and what. Our data and findings are presented on our website but before the final product we had gone through a process of narrowing down our scope. Our website is a result of editing, analyzing and interpreting our data that consist of both personal interviews and larger datasets. As argued by visual theorist and author, Johanna Drucker, data often comes across as mere descriptive and therefore lacks the acknowledgement of the interpretation process behind the final graphical expressions. It is part of a discussion within digital humanities of how to use bigger datasets and still be rooted in the humanistic knowledge production it is based on. By combining the quotes with the findings from the datasets, we have highlighted the personal stories and experiences behind the numbers. At the same time we have presented our findings not as objective truth, but as perspectives that make the reader reflect and engage in the subject.
There are already a vast number of narratives centered around community gardens. They tell stories of resistance towards capitalism and corporate housing, they strengthen communities and make healthy food accessible, they encourage the need for a more sustainable city and so much more. With our project we hope to contribute to these narratives with the added gaze of DH. We looked upon community gardens with curiosity and brought new perspectives to these green spaces scattered around the city.
Audience
When considering our intended audience we found it important to analyze who could potentially benefit and be interested in our project. There could be many different actors in the field of community gardens since we are exploring different aspects of them. It could be on a political, educational and academic level. However, to narrow down the scope of who we wish to target specifically we believe our work would be most helpful and relevant to those already engaged in community garden work. This accounts for both organizations and those in the academic field. In other words we are targeting volunteers, coordinators and scholars who wish to strengthen the effort done around community gardens. We believe these individuals have a shared interest in reinforcing community gardens on both a local and national level. However limited resources and time may prevent them from fully committing to being a full time supporter. We are aware that individuals that hold an interest in helping may be preoccupied with their jobs and general personal lives. For that fact alone we have worked diligently on the website being clear, easy to use, informative and diverse through the showcase of different perspectives. The tone of our work is meant to be educational, inspiring and enlightening. We hope to create a trust in our project that is legit and worth considering and exploring further. It would be great if people wish to engage in community gardens after looking at our website, but our main purpose is for our audience to get a better understanding of community gardens and their accessibility and impact on both a local, neighborhood and broader city level.
Throughout our project we have gained a better understanding of our audience by having the opportunity to speak first hand with GreenThumb coordinators, garden members as well as people interested in community gardens on both a private and academic level. It has been a process of reshaping our focus that has made our website stronger for the intended audience. An example of how we engaged and included our audience into the process of the final website is through our ethnographic work. At Liz Christy Community Garden our interviewee wished to know what other gardens grew across NYC, so that he may reach out to them to gain tips on how to grow certain produce. His statement is one of the reasons why we designed and included a map centered around produce found in community gardens in New York City. Our map displays what kind of fruits and vegetables are available along with where they are grown. We intended for this visual to fulfill his, as well as potentially others interest in discovering the production of goods grown by other areas and neighborhoods. This in turn can also possibly strengthen the network between gardens.
Furthermore, we also hope our website can be of service to the garden members engaged in building up their spaces. Through our research we have found that gardens have to apply for a grant by means of sponsorships through organizations or other donors. Greenthumb, for example, has been known to provide programming and materials for the gardens they fund. Sustainability of these gardens are dependent on continued financial support, so we also aspire for our work to be used as a viable resource and evidence in helping the gardens consistently apply for these grants. More than simply presenting information, we want to help these gardens as well. We observed first hand at how certain gardens still struggle economically. Upon a visit to 100 Quincy Community Garden, we were told how the volunteers were struggling to get running electricity for their space. This was to be used for light fixtures and functioning BBQ grills for the residents. Judging by this statement as well as the results demonstrated by our “Who’s got access to them” map displaying the gardens correlation to household income, we know that most gardens are built in lower income areas with very little access to resources. For that reason, our audience is also inclusive to those who wish to aid in the garden’s well being.
Activities and Accomplishments
Our initial goals were to have a simple website in which anyone can go and visit in order to find information on community gardens. As we grew as a team, our plans shifted week to week. At first, we found a plethora of datasets when we conducted a web analysis. The data we found was mostly organized by community districts, names, location, hours open and “garden status.” All these metadata attributes were designated by Greenthumb. As we continued to have our weekly meetings, we kept asking each other if we could keep trying to find more data. In our work plan, we wanted to find at least five different types of datasets. However, we were at the mercy of what’s currently available online. Unfortunately there is not a lot of data in comparison to other open NYC data files.
Our new question became, “should we add on to the currently available datasets?” This was particularly important because some of us wanted to create new data while others wanted to use what was already available to make a viable website. Due to time constraints and availability of our team members, as well as a consultation with Prof.Maney, we decided that the majority of our work would rely on datasets already made. However, any CSV files that we couldn’t find online were constructed ourselves by doing a general web scrape.
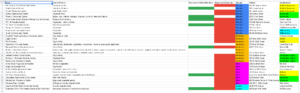
At the end of our project, we were able to find and make around twenty usable datasets. We then organized them in a specific folder labeled “Data Collection”
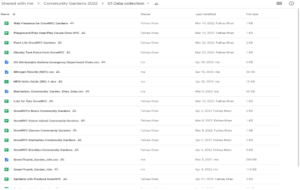
Many of these datasets were either combined into one mega sheet or just looked upon as references for our upcoming questions.
The main dataset we used was the Greenthumb_garden_info.cvs
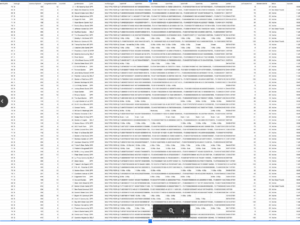
When we first uploaded the file to Tableau online, we were met with a barrier. We had to research and learn how to display this data and figure out what can be properly translated within the system. Since we decided to make maps, we had to learn how to display numbers into a visualization. Our first map was ambitious, we wanted to display hours open, days open and location pinpoints. We soon realized that Tableau wasn’t that robust or our skillset wasn’t high enough to display it. We ended up using only two columns in the dataset; name of the garden and their status. A reduction of the dataset allowed us to produce a map in which we show people the status of community gardens in NYC: Our first question we created as a team was simple. : “Where are they?”
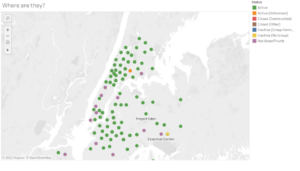
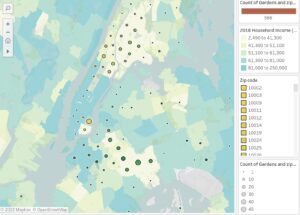
In our next map we wanted to combine two points of data into one image. We, as a team, asked the next question: “Who’s got access to them?”
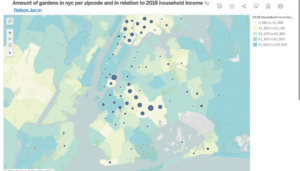
As social scientists and digital humanists, we often pondered, “we know where these gardens were located, but how many people had access to them?”. We came up with the idea of combining our already created dataset with the addition of income levels to the map. We thought this was an excellent idea as many aspiring social scientists can look at this map and try to find correlations we did not previously account for. While there were plenty of income datasets online, Tableau offered a data layer with 2018 income data that was tied in relation to neighborhoods. This is what we ended up going with. When we first imported the dataset and tried to overlap it, we were hit with another barrier. Tableau could not find or connect the two datasets. After countless hours of trying to figure it out, we deduced that we needed to incorporate the amount of gardens through zip codes; however, our dataset did not provide that. Our next step was then to manually count/group the amount of gardens per zip code. After creating a new dataset we were able to produce the following map:
Health and green spaces are often seen as a symbiotic relationship. The idea of this stemmed from a categorization of the Bronx and Manhattan. There was a famous quote from a newscaster that stated “The Bronx is burning”, similar quotes are attributed to the famous Hell’s Kitchen in Manhattan, where the area in the 1800s was seen as “tough.” Our next data visualization wanted to help tackle a common misconception of NYC health. Why are kids so prone to respiratory conditions and do we think that community gardens are helping to fight that? Our next question regarding community gardens was therefore: “Can they affect your health?” We were able to use NYC’s own Environment & Health Data Portal to download and organize data. Thankfully, we had a healthy amount of choices. We ended up with two datasets regarding the number of ER visits from 2015- 2017 and another dataset regarding Nitrogen oxides (NOx) which included nitric oxide (NO) and nitrogen dioxide (NO2). These are a group of pollutants formed by combustion that can cause damage to lung tissue causing breathing and respiratory problems. We felt that these two datasets would help create a story that the community can review and ponder on if they were considering expanding community gardens in the area. As data and social scientists, we did not have formal hypotheses of whether community gardens were helpful or not. However, we were a bit biased in wishing that they did.
Our next technical barrier with Tableau was even more intense than the previous two. The dataset we downloaded was extremely incompatible with the software. We were not able to generate any sort of data map to showcase the public, which almost led us to discarding the idea all together. Nonetheless, we persisted in trying to create a basic map displaying at least some of our collected data. What we noticed is that the NYC Environment & Health Data Portal had their own data visualization and their dataset was more in tune with community districts than the zip codes that we were already accustomed to. Once again, we needed to translate and manually find where these community districts landed with zip codes. We unfortunately had to make the decision of cutting down the data displayed on the map as they kept getting lost in translation. Even worse, we couldn’t link both datasets with our already created mega map of community gardens. Nevertheless, we generated the following two maps in order to give the community an idea of where the highest level of ER visits and NO pollutants were located. We kindly wanted the community to compare our data visualizations on our websites in order to research more. Below are the two data visualizations:
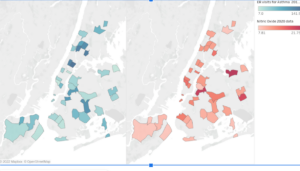
The results were a bit shocking for us as we compared these maps to our generated maps. We can see that community gardens almost made no noticeable difference. The largest number of community gardens are located in areas of Brooklyn, East Village and the Bronx. But when compared to the health data we unfortunately did not find any notable connections. We would like to leave this up for future researchers to dig deeper. Perhaps a more in depth study on community gardens and other green spaces like parks and their locations can be connected back to the overall health of people in NYC.
Apart from NYC map visualizations we also created a pie chart and made a wonderful tree map to demonstrate some data that we thought would not be sufficient in a standard city map. We used a data sheet, constructed ourselves through an investigation of GrowNYC and created a pie chart of gardens with a digital presence.
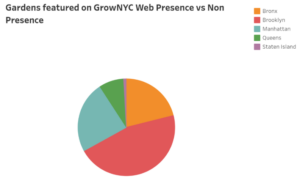
This chart shows us that Brooklyn has the most digital presence in comparison to other boroughs. What is also interesting is that Queens has the least, even though they have a decent amount of gardens. We are not sure why these gardens aren’t digitized yet. The web scrape we did, did not really inform us of why certain places had websites while others did not. During our ethnographic interviews, we found out that it is often up to the volunteers in the garden that have the skills and motivation to work on the web presence. So it is mainly up to them to decide to have a digital identity. We also presume that the lack of social media or a website can also be due to the demographic of the residents that live in such places. We hope that this graph can inspire more people to create more digital websites.
Our last visualization showcases one of the many beneficial attributes provided by community gardens; the accessibility to fresh produce. An increased number of fruit and vegetable intake is a well known remedy in improving dietary habits. Not only are garden grown foods packed with vitamins and antioxidants, they’re also a great money saver. The tree map below displays community gardens in NYC that are ripe with goods. The scroll over feature in our second map provides indicators about those that give away to local residents and markets.
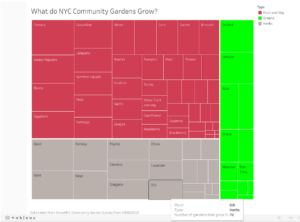
What is really cool about this map is that a user can hover over a produce box, and see how many gardens grow it. We hope that one day a savvy digital gardener can create this into an interactive map where one can go and look for select produce.
Aside from the visualizations we also wanted to talk with people about their own understanding of the community gardens and their work. As we mentioned before there are around 500+ community gardens in New York City. It was obvious we only had enough time to talk with a few, so narrowing down the list of possible interview subjects was also a challenge. From the beginning we knew that the ethnographic work would not represent all gardens, but rather give a glimpse into the inner workings of them. We first began our process by constructing a spreadsheet with the garden’s name,neighborhood, year, type and size along with contact and status info.The selection process was not only determined by which garden we wished to talk to, but also which ones we could get in contact with and if they wished to participate. In beginning our process of contacting gardens, we first decided to send messages through the email addresses gardens have listed on various websites. When we did not get a response to any of our emails, we knew we had to go in a different direction.This is when we decided to directly contact Greenthumb. The coordinators were more than helpful with providing us with phone numbers of gardens they thought would be interested in participating. In the end we managed to get an email back from Liz Christy Community Garden as well as a phone call with 100 Quincy Community Garden. The interviews were conducted with enough time in between to refine our questions and method of interviewing.
After concluding the interview process we uploaded our audio files using a soundcloud player. We then worked on transcribing audio and worked together to analyze the most interesting findings. In the end we picked quotes we felt highlighted different ideas and reflections represented during the interviews. We then reached out to the informants and asked if they had anything else they wanted to further add. They did not have more to add so we went ahead with our original audio and transcripts. In the “Interviews of Community Garden Members” tab on our website we have audio with accompanied transcripts of interviews taken at Liz Christy Community Garden and 100 Quincy Community Garden.
Furthermore after the website’s completion, we sent a link to all of our interviewees. At the time of writing this we have not heard back from them but we hope for a positive response in the future.
Evaluation
Collective criticisms, feedback and suggestions gathered throughout the semester provided us with multiple avenues of assessment to help reach our final goal. Our first run of evaluations stems from our initial project proposal. After vetoing the original proposition of constructing a map used to observe the surplus of produce from NYC community gardens, we decided to go in the direction of an all in one interactive web hub to guide those interested in taking part or learning more about the city’s distinct green spaces. Although we considered our efforts in this plan to be plausible we were instructed to come up with a more solid project proposal going forward. One that allowed for us all to have a unified voice and understanding of what we were aiming to do with the community gardens we wished to study. The sound advice provided us with a more substantial grasp on the work we knew we would be able to create in about three months time. By cutting out the need to try to incorporate every information on community gardens we can possibly find, we were able to narrow down our scope and solely center on areas of interest that were most pertinent to both us and the field of DH. In the end, considering the fact that our final visualization list was cut down severely, we are most thankful that we did not go with our primary proposal.
Our second round of direct evaluation was guided by our appointed Tableau mentor, Kelly Hammond. At this point in our journey we had progressed to designing maps and graphs of the collected data we had accumulated. Due to the fact of us all being relatively new and inexperienced in the functions of the software, most of our time was being used to both figure out the system as well as how to go about choosing the best layout for our facts and figures. With the help of Prof.Maney we were put in contact with Kelly who was more than helpful in guiding us through what works best for our final vision. It was through an outsider’s perspective we were able to refine not only our visualizations but the purpose of our work as well. In lieu of working with the concept of finding what a community garden is in the digital age, we were enlightened with the idea of framing our work in the form of a story. In doing so we were also able to situate our visualizations through the form of questions, to entice viewers into finding out more. Our work became a bit more directed towards those already involved in NYC community gardens, which ultimately made more sense for how we chose to present our data. Additionally, Kelly also assisted us with the technicalities of the maps and graphs. With zoom meetings, email exchanges and helpful video instructions we were able to work within Tableau and turn out a more clear display of our material.
Lastly, feedback received at all mock presentations as well as from Prof.Maney before the showcase, were most helpful in elevating the user experience of our website. Some notable advice from a list of many included adding alt text to images, choosing a brighter color palette for the points on our map, differentiating colors on our map legends, adding links to a dead page and removing unnecessary widgets. In the end we tried our best to incorporate everyone’s tips and suggestions to benefit our work. Our wordpress site had gone through several external changes but the final product is exactly what we had envisioned when designing the landscape for this project.
Overall if we were to identify the biggest strengths of our work, we would first recognize the conciseness of the vast amount of data collected to create interactive visuals. Through copious amounts of spreadsheets we managed to create five intriguing and easy to use infographics. Moreover we also applaud our efforts into connecting with actual community garden members for an ethnographic study. Our audio and visual interviews provide a humanistic appeal to our project. It was imperative for us to give a platform to those who uphold the gardens and we are certain that those who visit our website will be captivated by the history and anecdotal accounts of the individuals who were gracious enough to lend us their time and voice. On the flip side, if we were to account for weaknesses our team suffered, time was definitely our biggest enemy as we have stated before. There were multiple maps, graphs and charts we wanted to present. Unfortunately our time management skills and lack of prior knowledge in Tableau prevented us from illustrating a more fleshed out understanding of what these gardens and the community that surrounds them have to offer. On a base level community gardens seem to be a neighborhood constructed green space to encourage outdoor activity.However our research has shown that these gardens have a much larger impact on the welfare of its residents. The many benefits these spaces provide include; increased access to fresh foods, improved air/water quality and boost of positive mental health and relaxation. These gardens are more than just an average neighborhood park and although we slightly touched upon the cardinal values these spaces hold, we are aware that we could have done more to truly make this an awareness project.
Continuation/Future of the Project/Sustainability
Although we do not have any formal plans as of yet to continue on with this project ourselves, we hope those that encounter our website will seek inspiration to possibly expand on it. Due to the fact that the majority of our extrapolated data is already publicly available through websites like GreenThumb Gardens, NYC Open Data and GrowNYC, we do not claim direct ownership over it. Therefore we are more than willing to let individuals outside of the group use our findings to help them in their exploration of community gardens or any subject area that pertains to that. Our hope for our project since the beginning has always been to create a suitable foundation for future researchers, as evidenced by our data management plan. The data we created and published will be under standard sharing protocols. The data will not be restricted nor behind a paywall. We hope for a large audience to use this information, one being community leaders themselves using this information to enhance their connection to their gardens. Furthermore all of our work has also been saved on to a shared google drive. In the event an individual wishes to gain even more info on what we have found, they may contact us through our Graduate Center emails, listed on our website. Although we will insist on being credited if our visualizations or self made data sheets are used, we will grant permission for utilization. Judging by the positive response we have garnered from those who have viewed our site, we know we have already piqued interest. However, possible limitations we may come to expect from making our project public and available, reduces down to our ethnographic work. This aspect of our project is limited to our website and is not in use for share in order to protect the participants’ privacy.
In conclusion the longevity of our work is dependent on the standing of the Cuny commons wordpress site, so we hope to garner an audience before our web license runs out. In spite of the fact we were granted a stipend to aid in the preservation of our work, we have decided to use the majority of funds to give back to the community gardens who have paved the way for this project to be made. Furthermore, although we are proud of the fruits of our labor we are cognizant of the fact that our website seems to be more of a first step to a much larger study. Even if we ourselves are no longer at the helm of it, we believe spin- off programs and extended development will be most beneficial to those in DH as well as the gardens themselves. We are confident in stating that there is still so much more about NYC community gardens that can be uncovered and investigated. Projects based on the gardens unique history and a deep dive on neighborhood obesity rates and its correlation to available gardens in the area, are just some that come to mind when hypothesizing on the possibilities our work can go. In essence we believe an improved version of our project would be better for a permanent web address. Perhaps in the future, it may be one of us that chooses to complete this task. But once again we invite anyone who is willing to dive into the world of these wonderful gardens.
Bibliography
-
Drucker, Johanna (2011) “Humanities Approaches to Graphical Display” Digital Humanities Quarterly Volume 5 Number 1. The Alliance of Digital Humanities Organizations and The Association for Computers and the Humanities
- Gittleman, M. Librizzi, L. Stone, E. (2010) “Community Garden Survey”. GrowNYC and GreenThumb.
- Greenspan, Brian (2019) “The Scandal of Digital Humanities” Debates in Digital Humanities 2019 Chapter 9. University of Minnesota Press
- Loggins, Donald (2007) “Garden History”. Visited 19 of May 2022: http://www.lizchristygarden.us